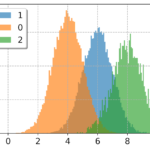
In the realm of data analysis and visualization, histograms stand as one of the most fundamental and powerful tools available to data scientists, statisticians, and analysts. Python, with its rich ecosystem of libraries and straightforward syntax, has emerged as a preferred language for creating these insightful graphical representations. This article explores the concept of histograms, […]
Articles Tagged: matplotlib
How To Create Python Interactive Plots with Matplotlib
Static plots can tell a story, but interactive plots allow users to explore the story of the represented data on their own. Not only does this make the data more interesting to investigate, but it also makes drawing insights from the data easier. The Python community is rich with tools that make creating interactive plots […]
Mastering Matplotlib Plotting: Code Samples and Tips (In Python)
Whether you’re learning Python just for fun or have a career as a data scientist or business analyst, it’s a good idea to familiarize yourself with matplotlib. It is a Python module that allows us to visualize data, helping us understand and analyze it to meet the business’s goals. One of the best things about […]
Latest Articles
- How Python Developers Discover Technical Content in 2025: The Rise of Independent Blogs
- How Python, AI, and Machine Learning are Transforming the Future of Cybersecurity?
- Jira Power Moves Every Python Pro Should Know
- Integrating Shopify with External Systems Using Python
- Infrastructure Security Tips to Protect Your Python-Based AI Projects Before Deployment
Tags
Python is a beautiful language.


